Gauri Chaudhari

Gauri Chaudhari

Data Professional

Indiana University Bloomington

About me

As a Data Analyst with a Master’s degree in Data Science, I am a relentless interrogator of data. I take pride in transforming raw, unrefined data into valuable insights that drive strategic decision-making and measurable impact.

I thrive on a hands-on approach to data analysis, leveraging a broad toolkit — from machine learning algorithms to statistical modeling — to uncover patterns, trends, and insights others might overlook. My curiosity drives me beyond familiar ground; I am deeply committed to continuous learning and staying ahead in the fast-paced, ever-evolving field of data science.

  Click here to view my projects!
  View my   One Page Resume

Interests

  • Data Science
  • Data Visualization
  • Statistical Analysis
  • Predictive Modeling
  • Natural Language Processing

Education

  • MS in Data Science

    Indiana University - Bloomington

  • BS in Computer Engineering

    University of Pune
Skills

Statistics

Data Analysis

SQL

Python

R

Data Wrangling

ETL Processes

Machine Learning

Data Modeling

Data Visualization

AWS

Git

Projects

*

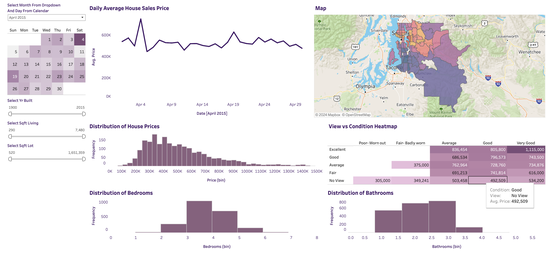
Interactive Housing Sales Analytics Dashboard

Explore house sales in King County, Washington by price, location, bedrooms, and condition

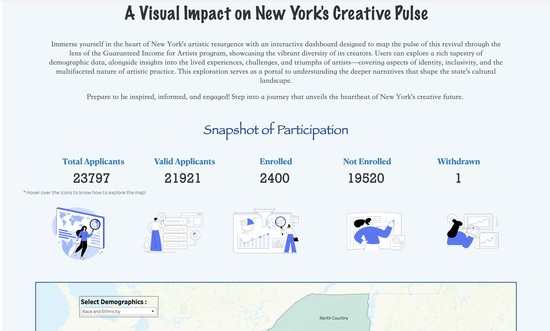
A Visual Impact on New York’s Creative Pulse

Tableau data visualization entry that won us 3rd position in the O’Neill Center For Cultural Affairs data viz competition [O’Neill School of Public and Environmental Affairs]

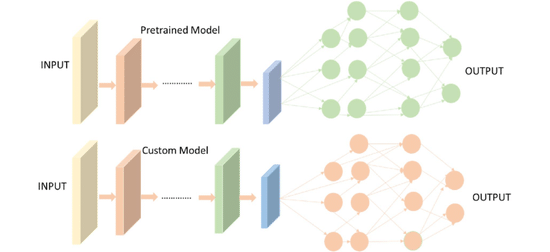
Investigating Transfer Learning and Scratch Training for Image Recognition

This project investigates image classification by comparing the techniques of transfer learning using ResNet50 and training a convolutional neural network from scratch.

Classifying TV Show Quotes using BERT

Leveraged BERT’s NLP power to distinguish Sci-Fi from Sitcom

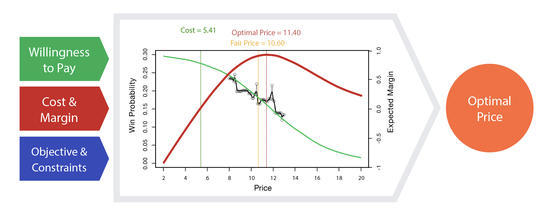
Boosting Sales Margin with Data-Driven Price Optimization

Exploration of how data analytics and optimization strategies can significantly enhance the profitability of products sold on e-commerce platforms

Journey so far


Senior Consultant - Data Analyst

Heartland Community Services

Aug 2024 – Present Indiana
  • Designing a consolidated financial dashboard for a property management by integrating QuickBooks, Power Query, and Microsoft Excel, enabling global visibility into common KPIs, bank balances, monthly profit/loss, and operational expenses across multiple entities.
  • Collaborating with cross-functional stakeholders to prioritize key financial metrics, for dynamic reporting by implementing memorized reports and class-based views across QuickBooks company files.
  • Designed Power BI dashboards with interactive cluster visualizations (heatmaps, scatter plots), enabling non-technical teams to identify actionable insights in <2 click.
  • A/B Testing Framework: Led a statistical experiment (SciPy) testing rent increase strategies across 100 properties, validating a 5% price hike as optimal (p-value <0.05), projected to drive $250K incremental revenue in 2025.
  • Data Pipeline Automation: Built an AWS Glue/S3 ETL pipeline to consolidate financial data from 26 QuickBooks files into a centralized PostgreSQL database, cutting manual reporting time by 20 hours/month.
  • Designed and automated an AWS Glue–S3 ETL pipeline that ingests data from 26 QuickBooks entities into a dimensional (star‑schema) PostgreSQL, enabling cross‑company analysis of bank balances, P&L, and expenses while saving 20+ hours of manual reporting each month.
  • Engineered a property segmentation model using K-Means clustering (Python, Scikit-learn) to categorize 100+ real estate assests into 4 performance-based clusters, improving operational decision-making and reducing maintenance costs by 15% for high-cost properties.


Data Analyst

Tata Consultancy Services - Digital Cadre

Jul 2019 – Aug 2022 Mumbai, India
  • Designed and modernized dashboards and visualizations in Splunk and PowerBI for GE Digital, providing stakeholders with real-time insights into data trends, anomalies, and key performance indicators.
  • Slashed cloud waste by $160 K / month and boosted system reliability 75 %  by automating discovery, visualisation, and clean‑up of orphan / unused EC2, RDS, Redis and BOSH‑created resources; Python + SQL pipeline flagged anomalies in Splunk dashboards and triggered one‑click remediation.
  • Automated 90 % of data collection and reporting with AWS Glue, Athena, and QuickSight, replacing manual CSV wrangling and giving each business unit real‑time cost‑and‑capacity views; insights drove a 22 % drop in EC2 and database spend.
  • Delivered predictive uptime by training a lightweight XGBoost model in SageMaker that forecast CF / BOSH instance failures a week ahead, cutting unplanned downtime 15 % and informing autoscaling thresholds.
  • Led cross‑team root‑cause analysis using advanced SQL, Python and Excel to trace billing spikes to mis‑tagged resources and runaway app logs—saving $12 K in a single incident and winning “Digital Cadre Star” award for impact‑first problem solving.


Data Scientist Intern

Armstrong Ltd

Sep 2018 – Apr 2019 Nashik, India
Designed and implemented a real-time analytical predictive model utilizing back-propagation algorithm to identify the type, timing, and root cause of conveyor belt faults, resulting in an increase in uptime for Propus conveyors.

Accomplish­ments

AWS Certified Solutions Architect - Associate

See certificate

Data Engineer Associate

See certificate

Data Analyst Associate

See certificate

Associate SQL

See certificate

Google Data Analytics Professional Certificate

See certificate